|
|||||||||||||||||||
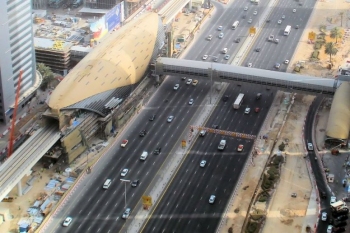
To achieve the combination of span and curvature for this bridge required unique design elements in order to optimize capacity and ensure stability. Varying end skews, non-uniform girder spacings and girder depths, lower lateral girder bracing, uplift resistant bearings, a 32 ton concrete counterweight, and a transversely staged deck pour would all end up being incorporated into the final design.
Bridge development Concept designs looked at a single-span and a three-span option, with the lower cost single-span option being preferred by the developer. For this, separate 37� wide, single-span eastbound and westbound structures were initially proposed but the potential for uplift on these separate, narrow, and highly curved structures resulted in one single 73� wide structure of greater stability being chosen. Further investigations into different skew arrangements and relative stability/uplift issues for this wider structure resulted in a final solution which used parallel end supports, one radial with some potential for uplift, and the other skewed to the roadway at about 45 degrees. To support the deck, eight centrally placed, equally spaced girders were proposed, but from analysis carried out it was found that, because of the severe curvature of the deck, the two girders on the outside edge were carrying four to five times more moment than the innermost girder. This caused GAI to move the set of girders more toward the outside of the curve, reducing the deck overhang. This gave a beneficial 10 percent reduction in load distribution for the most heavily loaded girder. Girder spacing was also adjusted. Spacing for the two outer, 120� deep girders was decreased from a fixed 9�-5� to 8�-0�, and the five inner, 104� deep, girder spacings were increased to 10�-0�. The 300� centerline radius on the bridge required a 4% superelevation, making the outside curb line almost 34 inches higher than the inside curb line. Because of this, the outside girders, which are only 16� deeper than the inside girders, do not control the under-clearance, so by using shallower girders for the inner six locations, ten valuable inches of overall bridge height were saved.
Analysis and design In order to verify the bridge�s behaviour during both erection and in-service loading both grid and finite element analysis software was used. 2D grid analysis was employed essentially as a �framework� tool for overall girder design, flange plate optimization, diaphragm design, and bearing design. 3D finite element analysis with LUSAS Bridge was used for detailed design to make sure that 3D effects were being accounted for in the individual bridge elements - something not possible with a grid analysis. Using LUSAS, dead load effects were assessed and final construction deflections were derived. Live loading was analysed for each vehicle lane with combinations and envelopes producing worst-case values. LUSAS was also used investigate bearing stiffnesses, lower lateral bracing loading, and to assess potential uplift from transverse deck pour sequences. A final analysis of the complete proposed design was carried out by a third party to verify the results obtained.
Deck pour sequence analysis The steel frame was erected on two falsework towers. However, prior to the deck placement, the towers were removed. As a result, uplift, calculated to be caused by pouring the deck, had to be overcome. With the entire steel frame in place to resist the effects of overturning, a concrete counterweight weighing 32 tons was placed adjacent to the inside edge girder at the radial abutment to reduce any uplift forces. Additionally the deck was placed in two transverse deck sections with the deck over the four innermost girder lines placed first. After the deck cured, the remaining section of the deck was placed, with the first pour acting as a counterweight. The bridge was constructed using uplift resistant bearings and uplift resistant foundations at the inside edge of the radial abutment so that there was adequate capacity for the entire uplift including live load effects shown in the worst-case analysis model. From analyses, mid-span dead load deflections were calculated and compared for each girder. After the removal of the falsework towers the calculated deflection for the outermost girder varied from 10.8 inches in the LUSAS 3D finite element model to 13.4 inches in the 2D grid analysis model, a variation of about 25 percent. This difference would be largely due to the limitations of grid analysis to include lateral bracing effects. The models showed good agreement regarding the end reactions and the uplift potential at the radial abutment. For the maximum downward reaction case at the outermost girder the models all agreed within 2 percent. Samuel N. Spear, engineer at GAI Consultants said: �LUSAS proved to be a valuable tool for the project. We especially enjoyed the ability to model the various stages of construction and in-service loading. He was also complimentary of the LUSAS support staff: �When we required modelling assistance the LUSAS support staff were helpful in answering our questions when the need arose�.
Avenues Walk Flyover Project Stakeholders
�LUSAS proved to be a valuable tool for the project. We especially enjoyed the ability to model the various stages of construction and in-service loading... and when we required modelling assistance the LUSAS support staff were helpful in answering our questions when the need arose� Samuel N. Spear, GAI Consultants
Share this articleFind out more
Other LUSAS Bridge case studies:
|
|
Software Information
|
|||||||||||||||||
|


 Find
out more:
Find
out more: